An analysis of board games: Part II - Complexity bias in BGG
This is part II in my series on analysing BoardGameGeek data. Other parts can be found here:
- Part I: Introduction and general trends
- Part II: Complexity bias in BoardGameGeek
- Part III: Mapping the board game landscape
Introduction
In Part I, I describe how I generated a dataset from BoardGameGeek and explored general trends in the rate of release, ratings and complexity. It also looked at the prevalence of different mechanics and themes throughout the hobby and how this has changed in the past 30 years. In this post, we’ll investigate complexity bias in BGG ratings.
Complexity bias in ratings
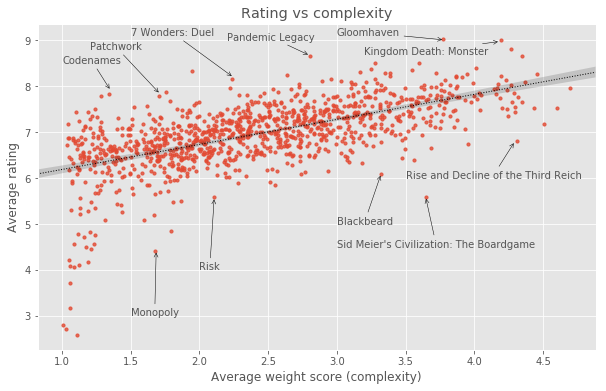
BoardGameGeek’s top 100 list is a very visible “beacon” for the hobby and many players will use this list to make decisions about which games to try or buy. It is comparable to the IMDb top 250 in the role it plays in shaping what the community perceives as the apex of Board Game experiences. However, one of the problems with the BGG top 100 is that it is disproportionately dominated by big and complex games. This makes it less useful for a sizeable majority of board game players looking for good new games to play, since many of the games on that list will look inaccessible and daunting. The relationship between a game’s complexity and how highly rated it is on BGG is not just limited to the top 100. In fact, there is a pretty clear correlation between how complex a game is and how highly rated it is on BoardGameGeek, as shown below.
 Note: The above graph only includes games with > 100 votes for game weight
The existence of this correlation in the BGG dataset makes it easier to understand why the top 100 is disproportionately populated with big, complex games.
It is worth making a couple of comments based on the graph above:
- This graph does not necessarily mean that more complex board games are inherently better. While the graph above does show a clear (and statistically significant) relationship between perceived complexity and overall rating, we need to appreciate that there is a strong sampling bias present in our dataset that leads to this result i.e. Complex board games disproportionately appeal to the BGG user base.
- A curious feature of the graph above is the tail of games of low complexity and low ratings at the bottom left of the plot. This “tail of spite” consists of relatively old mass-appeal games. Every single game in the tail of spite was released pre-1980, with many being considerably older than that. The games that form the tail of spite are shown in the table below:
| Name | Avg. rating | Avg. weight | Year published |
|---|---|---|---|
| Tic-Tac-Toe | 2.6 | 1.11 | -1300 |
| Monopoly | 4.4 | 1.68 | 1933 |
| Trouble | 3.7 | 1.05 | 1965 |
| Pay Day | 4.7 | 1.23 | 1975 |
| Checkers | 4.9 | 1.79 | 1150 |
| Pachisi | 4.5 | 1.21 | 400 |
| Sorry! | 4.5 | 1.17 | 1929 |
| Battleship | 4.5 | 1.23 | 1931 |
| Mouse Trap | 4.1 | 1.12 | 1963 |
| Connect Four | 4.8 | 1.20 | 1974 |
| The Game of Life | 4.1 | 1.19 | 1960 |
| Operation | 4.0 | 1.08 | 1965 |
| Guess Who? | 4.8 | 1.12 | 1979 |
| Candy Land | 3.2 | 1.05 | 1949 |
| Snakes and Ladders | 2.8 | 1.00 | -200 |
| Twister | 4.6 | 1.09 | 1966 |
| Pick Up Sticks | 4.2 | 1.05 | 1850 |
| Bingo | 2.7 | 1.02 | 1530 |
| Memory | 4.7 | 1.16 | 1959 |
Correcting for the complexity bias
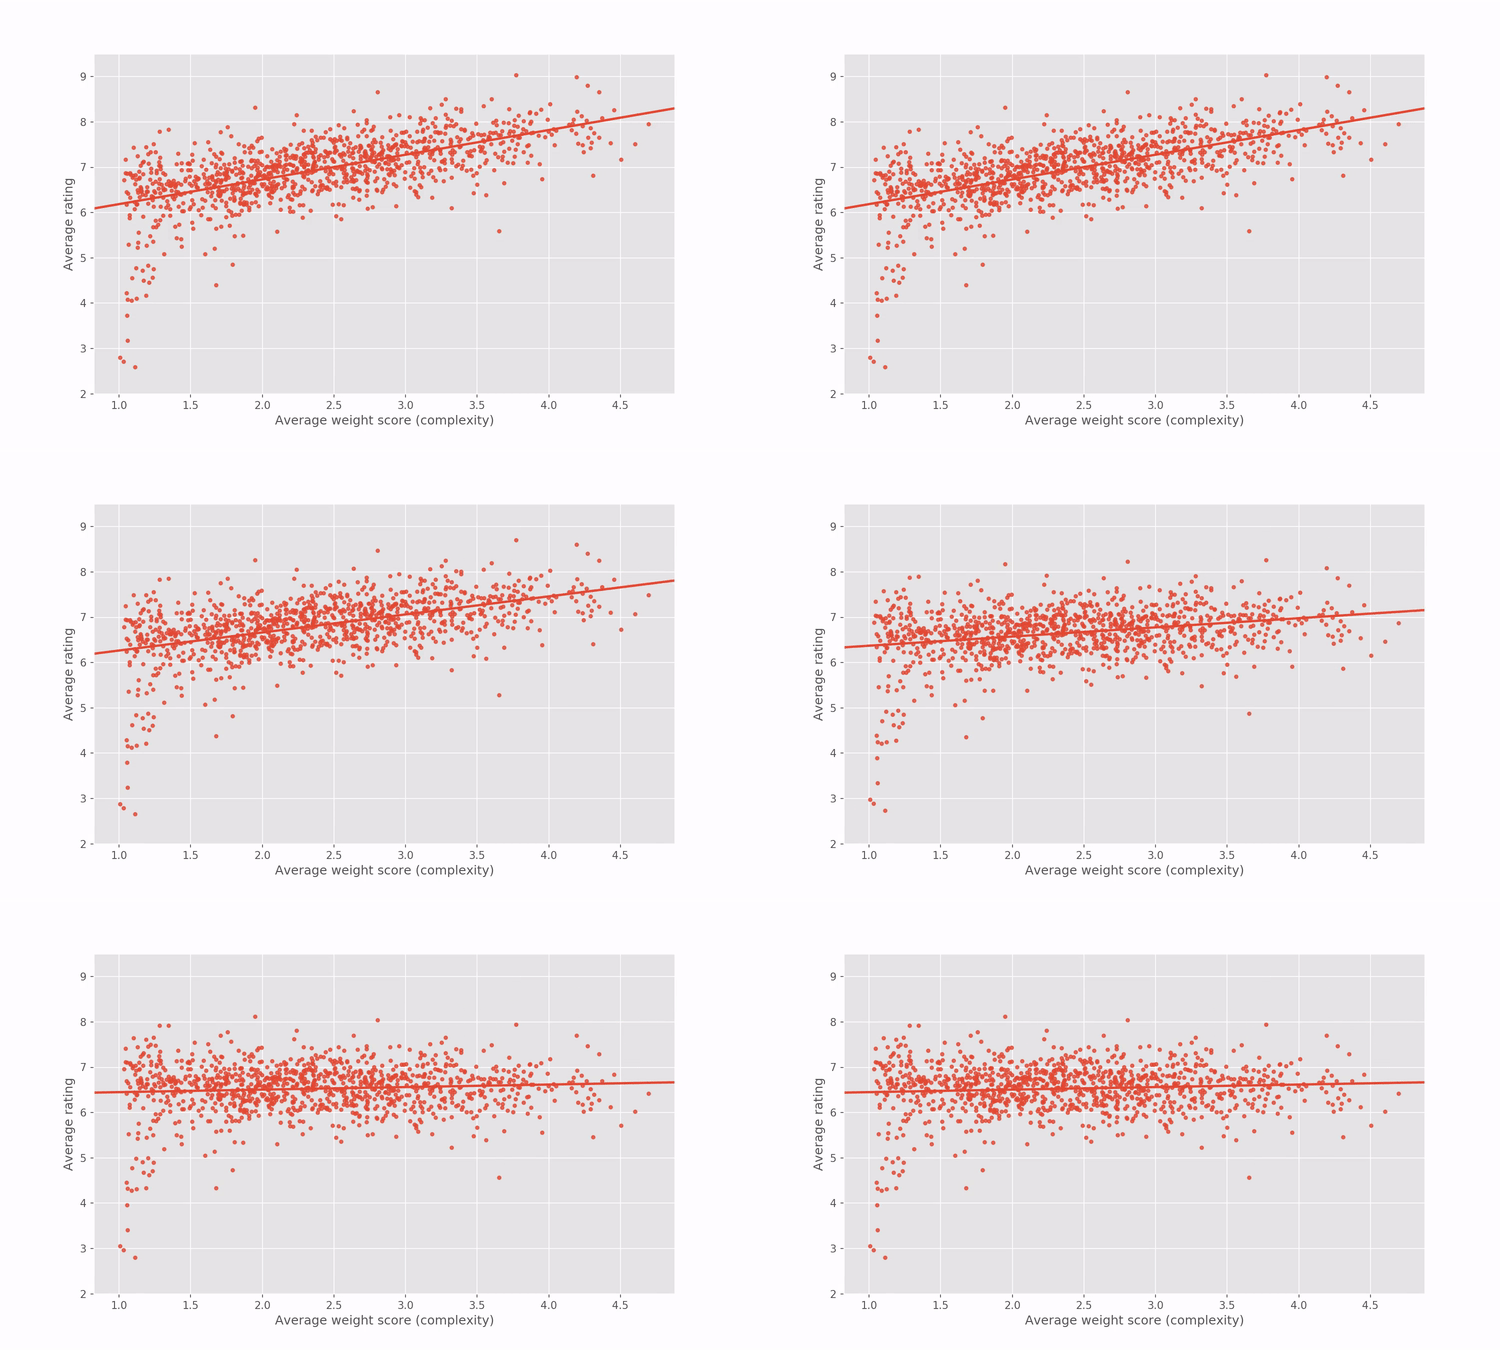
Since the regression in the graph above reveals how games’ ratings are related to complexity within the BGG dataset, we can artificially correct for the correlation by adjusting the game ratings to penalize complex games and reward simpler games. For the more mathematically inclined among you, I’m referring to the residuals of the regression between rating and complexity.
A short illustration goes a long way to intuitively explain what the process does.

Applying that artificial correction gives us a “complexity-agnostic” rating for all games. Below is an interactive plot showing the rating vs complexity after the rating correction. Hover over any point to see the name of the game and the game’s new BGG rank and rating.
Hover your mouse over (or tap if you’re on mobile) any point for more information about the game
We can use these corrected ratings to re-rank all of the games and obtain a complexity-agnostic top 100 list. Note that BGG use something called a Bayesian mean to rank their games instead of taking the raw average ratings. What this does is effectively give each game a certain number of additional “average” rating votes. This is designed to push games with a very low number of ratings towards the average to prevent the top games list being dominated by games with only a couple of perfect score ratings. I’ve used a similar approach, using the same Bayesian prior as BGG (Bayesian prior of about 5.5 with a weight of around 1,000 ratings). As a result, there may be some cases where a game with a higher average rating end up having a lower rank than a game with a slightly lower average rating if the second has significantly more rating votes. The re-ranked BGG list using these corrected ratings has the complex games evenly spread throughout the ranked list of games rather than disproportionately skewed towards the top, thereby allowing some of the great, but less complex, games to shine through to the top 100.
I have applied the complexity-bias correction to all games with over 30 rating votes. Below is an interactive table that allows you to navigate the full list. It also includes a search function to find the impact of the complexity-bias correction on specific games.
Some of the games experienced a fairly substantial push up/down the rankings ladder as a result of the complexity bias correction. Some of the games that benefitted the most from this rating correction and have risen to the top 100 are Skull, BANG! The Dice Game, Love Letter: Batman, No Thanks!, Time's Up!, Spyfall and Sushi Go!. Conversely, some of the games that have been penalized the most are Twilight Imperium (Third Edition), Alchemists, War of the Ring (first edition), A Game of Thrones: The Board Game (Second Edition), Through the Ages: A Story of Civilization and Caverna: The Cave Farmers.
Looking at the revised top 100 from the list above, I still have some reservations about it, but it looks much more reasonable to me than the original BGG top 100 list. I suspect that for most board game players looking to try out new good games, this list would look far more approachable, while still being filled with excellent games.
I hope that you’ve enjoyed learning about the complexity bias inherent in the BoardGameGeek dataset and how we can correct for it. The discussion on whether or not complex games really are better is far from over, but hopefully people looking for some of the lighter great games to play will find this more welcoming take on the BGG top 100 useful.
The code I wrote for this analysis can be found here in the form of a Jupyter Notebook (Python).
Thanks to:
- Colm Seeley for co-authoring this work with me
- Catherine Maddox for great feedback on the writing and presentation of the post
- Quintin Smith (Quinns) from Shut Up & Sit Down for allowing me to use material from one of his talks in a presentation of this analysis
- GitHub user
TheWeathermanfor creating the BGG scraper that I modified to collect the data used for this analysis. - GitHub user
vividvillafor building the useful CSVtoTable tool
If you enjoyed reading this, you may also enjoy: